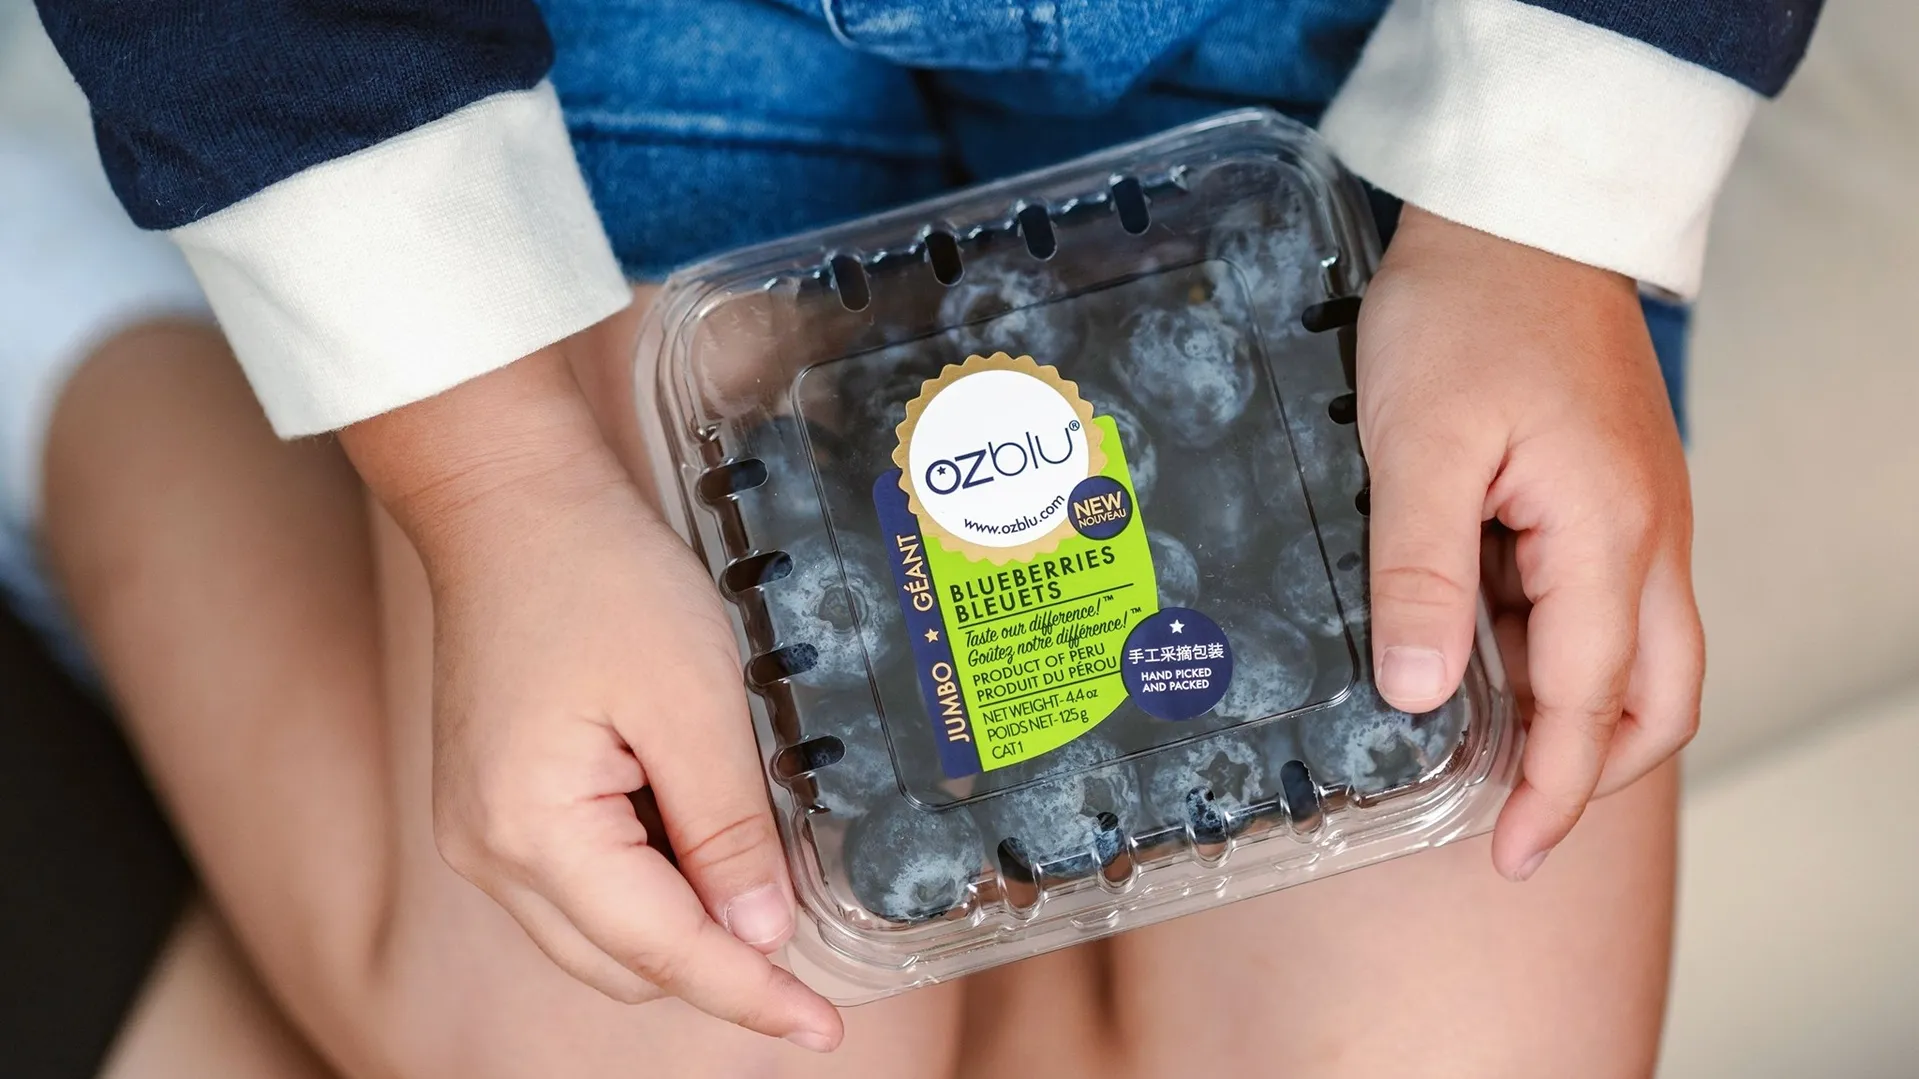









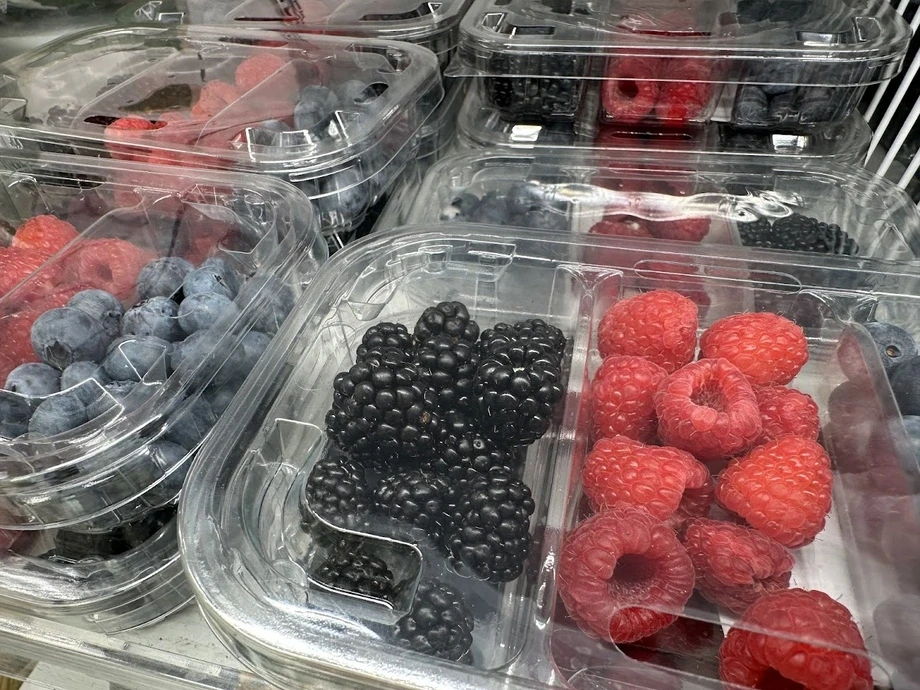
In the produce department of modern grocery retail, berries have become an increasingly strategic category: blueberries, raspberries, blackberries and red currants are gaining more visible shelf space, entering promotional campaigns and multiplying across formats.
However, shelf presence alone is not enough to define the value of the offer: what really matters is the balance between perceived quality, freshness, price, assortment and commercial consistency.
The analysis of the quality/price ratio, summarized by the QP indicator, makes it possible to distinguish very different models. Some retail banners achieve good results with few references, relying on a selective and competitive assortment; others combine a high QP with a broad range, turning berries into a true category stronghold. There are also banners with many references but a below-average QP, a sign that range width alone does not guarantee value for the consumer.
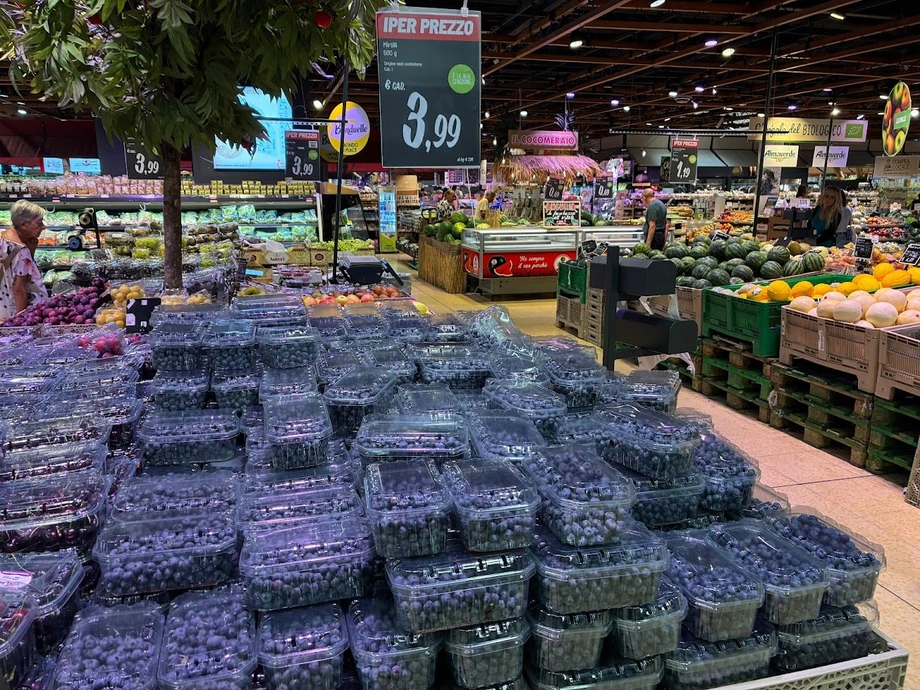
The overall picture shows an increasingly selective category, where competitiveness is not measured only by the number of references or the absolute price. In berries, the winners are those able to make a balanced proposition clear to the customer, combining quality, price and choice. The detailed report analyzes the performance of each retail banner, distinguishing the average QP level from the actual assortment coverage.
The dataset on which this analysis is based includes 1,798 evaluated samples, 408 store observations across 66 retail banners, aggregated into 34 groups and distributed across 11 cities. The observations were carried out weekly from January to June 2026 by the Italian Berry Observatory.
The overall average Quality/Price Ratio (QP) for the period is 2.58, while the median is 2.75. The total number of references recorded is 1,931, with an average of 4.7 references per store.
| Indicator | Value |
|---|---|
| Total references | 1,931 |
| Evaluated samples | 1,798 |
| Stock-outs | 133 |
| Stock-out rate | 6.9% |
| Stores | 408 |
| Retail banners | 66 |
| Groups | 34 |
| Cities surveyed | 12 |
| Average QP | 2.58 |
| Median QP | 2.75 |
| Average references per store | 4.7 |
| Survey days | 21 |
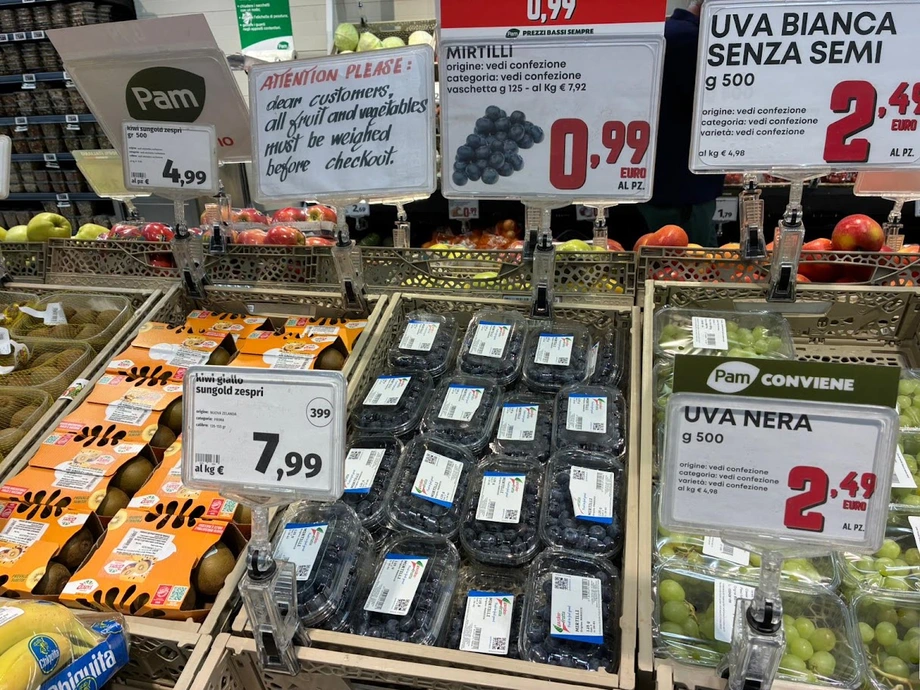
The analysis examines, for each retail banner, the quality/price index and the size of the assortment. A good QP with few references does not carry the same weight as a good QP achieved with broad assortment coverage. The first case indicates efficiency and selection; the second points to more complete category management.
Four retail banner profiles
- High QP and broad assortment: the most complete banners, interesting as benchmarks.
- High QP but narrow assortment: an efficient offer, often discount-based or highly selective.
- Broad assortment but weak QP: the category is present, but perceived value is not competitive.
- Low QP and limited assortment: weak category presence.
Ranking of the main retail banners
The table considers retail banners with at least five observations. This filter reduces the weight of occasional cases and allows for a more robust reading of the relationship between average QP and assortment coverage.
| Retail banner | Obs. | Cities | Avg. QP | Med. QP | Avg. ref. | Reading |
|---|---|---|---|---|---|---|
| Aldi | 21 | 10 | 3.24 | 3.33 | 3.8 | QP leader, selective assortment |
| Esselunga | 18 | 8 | 2.98 | 3.04 | 8.3 | Best QP/range balance |
| Prix | 9 | 4 | 2.97 | 3.21 | 2.1 | High QP, minimal assortment |
| Il Gigante | 5 | 3 | 2.92 | 3.10 | 7.6 | Very positive, more limited base |
| Lidl | 24 | 11 | 2.90 | 3.19 | 3.1 | High QP, limited range |
| Pam | 19 | 8 | 2.89 | 2.91 | 5.1 | Good overall balance |
| Despar | 6 | 2 | 2.72 | 2.85 | 3.8 | Above average, selective range |
| In'S | 18 | 9 | 2.68 | 2.90 | 2.7 | Good QP, limited assortment |
| Alì | 5 | 2 | 2.64 | 2.75 | 6.0 | Good range and above-average QP |
| Rossetto | 6 | 3 | 2.63 | 2.58 | 7.0 | Broad range, positive QP |
| Spazio Conad | 8 | 4 | 2.62 | 2.62 | 6.1 | Best Conad format |
| Eurospin | 24 | 11 | 2.61 | 2.85 | 3.6 | Above average, limited range |
| Ipercoop | 13 | 6 | 2.57 | 2.80 | 6.9 | Strong assortment, QP in line |
| Eurospar | 13 | 6 | 2.49 | 2.58 | 6.5 | Broad range, below-average QP |
| Dpiù | 12 | 6 | 2.40 | 3.16 | 1.8 | High median, average penalized by zero values |
Retail banners below the top tier
| Retail banner | Obs. | Cities | Avg. QP | Med. QP | Avg. ref. | Reading |
|---|---|---|---|---|---|---|
| Coop | 17 | 8 | 2.37 | 2.72 | 4.4 | Below-average QP, irregular performance |
| Conad | 15 | 6 | 2.37 | 2.63 | 4.1 | Below average |
| U2 | 6 | 3 | 2.36 | 2.49 | 5.5 | Fair range, weak QP |
| Conad Superstore | 12 | 5 | 2.34 | 2.40 | 7.2 | Broad assortment, weak QP |
| Conad City | 10 | 6 | 2.32 | 2.67 | 4.3 | Discontinuous performance |
| Sigma | 7 | 3 | 2.31 | 2.34 | 2.4 | QP and range below average |
| Famila | 5 | 3 | 2.24 | 2.16 | 5.2 | Fair range, low QP |
| Pam Local | 6 | 2 | 2.19 | 2.28 | 2.8 | Weak format compared with Pam |
| Md | 17 | 9 | 2.12 | 2.09 | 4.2 | Weak discount performance in the sample |
| Carrefour Market | 9 | 4 | 2.06 | 2.30 | 5.9 | Category present, very weak QP |
| Carrefour Express | 8 | 3 | 2.00 | 2.09 | 3.8 | Critical format |
| Penny | 11 | 5 | 1.96 | 2.26 | 2.9 | Weakest result among the main banners |
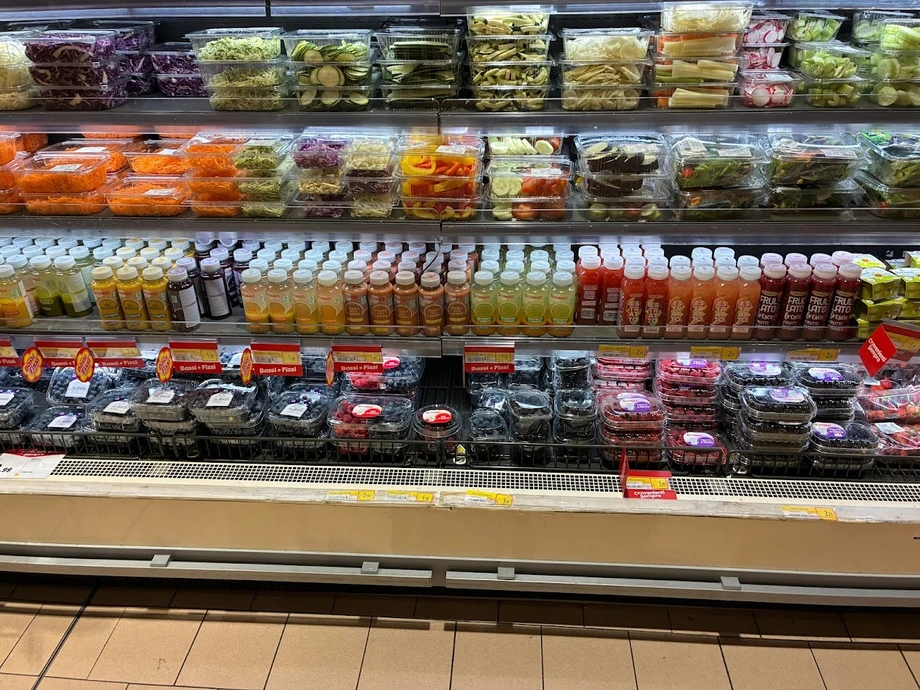 The most complete banners: high QP and broad assortment
The strongest benchmark is Esselunga. With an average QP of 2.98 and 8.3 average references, it is the banner that best combines quality/price and assortment depth. It is not the absolute leader in QP, but it is the most solid in the overall reading of the category.
Il Gigante is also very interesting, with a QP of 2.92 and 7.6 average references. The base is more limited, but the profile is positive: good quality/price and broad assortment.
Pam also deserves a positive reading: QP of 2.89 and 5.1 average references. It does not reach Esselunga’s depth, but it exceeds both the average QP and the average assortment level of the sample. It is therefore a banner with a balanced category presence.
Alì, Rossetto and Spazio Conad also fall within the positive quadrant: QP above average and average references above the sample average. In particular, Rossetto and Spazio Conad show good category coverage, with 7.0 and 6.1 average references respectively.
High QP, but selective range
Aldi is the leader of the sample in terms of quality/price strength: QP of 3.24, 21 observations and presence in 10 cities. However, its assortment coverage is limited, with 3.8 average references. This does not reduce the value of the performance, but it qualifies it: Aldi is very strong on QP, less so on range depth.
Lidl shows a similar profile: QP of 2.90, 24 observations in 11 cities, but only 3.1 average references. The median, at 3.19, is very high: this means that performance is generally good, but built on a selective offer.
Prix has a QP of 2.97 and a median of 3.21, but only 2.1 average references. This is a very clear case of an essential offer: highly competitive when present, but not very deep. In'S records a QP of 2.68 with 2.7 average references, confirming the same logic of limited but effective presence.
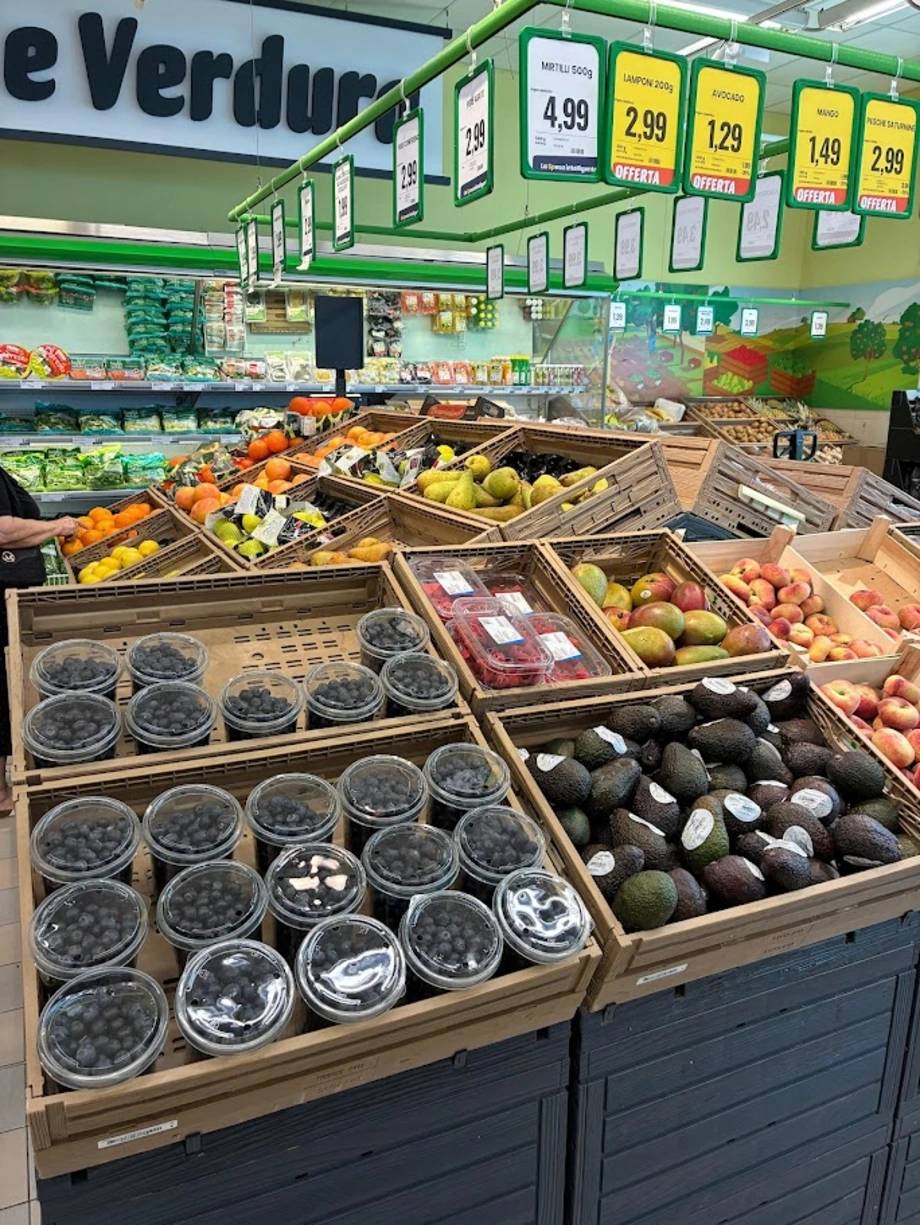
Broad assortment, but QP under pressure
This is where some of the most commercially critical situations can be found: retail banners that cover the category with many references, but fail to turn this coverage into competitive quality/price value.
Ipercoop has 6.9 average references, therefore good assortment depth, but a QP of 2.57, essentially in line with the average. The median, 2.80, is better than the average, indicating a certain discontinuity in results: several stores perform well, but others lower the overall result.
Eurospar has 6.5 average references, but a QP of 2.49. The category is well represented, but perceived value is below average. Conad Superstore is one of the most relevant cases: 7.2 average references, but a QP of 2.34. The assortment is broad, but the quality/price result is not competitive.
Carrefour Market shows a similar picture: 5.9 average references, but a QP of 2.06. The category is present, but the quality/price ratio is among the lowest. Famila and U2 also have fair coverage, with 5.2 and 5.5 average references respectively, but a below-average QP.
The weakest banners
At the bottom of the ranking we find mainly banners with a low QP and a not particularly distinctive assortment. Penny closes the ranking among the main banners with a QP of 1.96 and 2.9 average references: the figure is weak both in terms of value and depth.
Carrefour Express has a QP of 2.00 and 3.8 average references. It is slightly more structured than Penny in terms of offer, but remains very low in quality/price performance. Md records a QP of 2.12 across 17 observations in 9 cities: a fairly robust figure that signals a weak performance in the updated sample.
Pam Local, with a QP of 2.19 and 2.8 average references, appears much weaker than Pam. The internal comparison is clear: Pam performs well, Pam Local does not. Sigma has a QP of 2.31 and only 2.4 average references: neither value nor coverage appears particularly competitive.
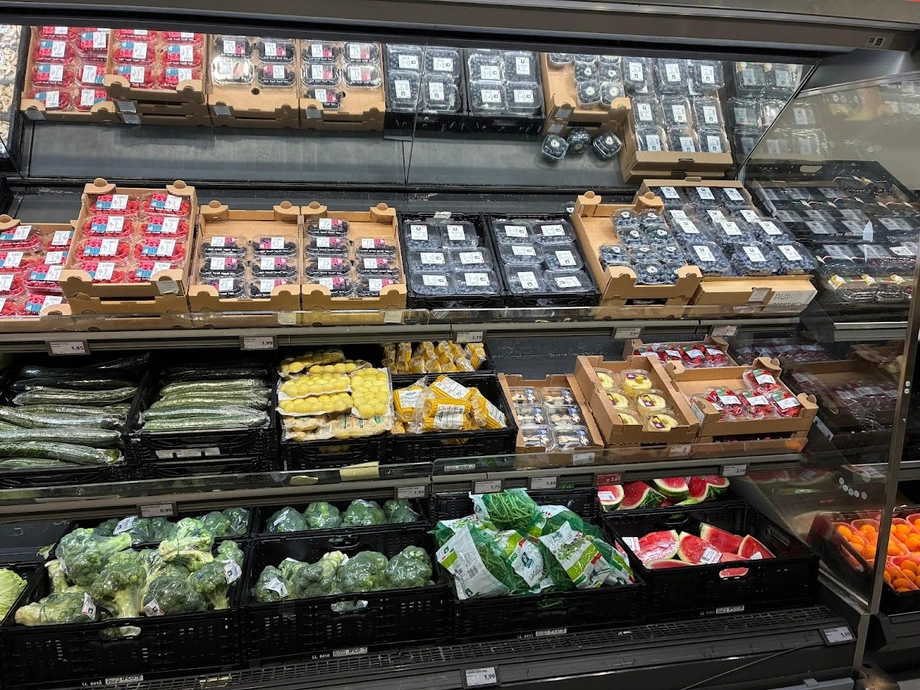
Reading by group
The group-level reading helps to reduce format fragmentation and understand the overall positioning of operators.
| Group | Obs. | Cities | Avg. QP | Med. QP | Avg. ref. | Reading |
|---|---|---|---|---|---|---|
| Aldi | 21 | 10 | 3.24 | 3.33 | 3.8 | Quality/price leader |
| Esselunga | 18 | 8 | 2.98 | 3.04 | 8.3 | Best overall benchmark |
| Lidl | 24 | 11 | 2.90 | 3.19 | 3.1 | High efficiency, narrow range |
| Prix | 11 | 5 | 2.70 | 3.13 | 2.1 | High QP, minimal assortment |
| Alì Supermercati | 7 | 2 | 2.68 | 2.75 | 5.9 | Good balance |
| Gruppo PAM | 44 | 11 | 2.67 | 2.79 | 3.8 | Good QP, medium coverage |
| Gruppo Poli | 11 | 1 | 2.66 | 2.50 | 3.5 | Positive, but territorially concentrated |
| Despar Italia | 21 | 6 | 2.62 | 2.78 | 5.9 | Good coverage, above-average QP |
| Eurospin | 24 | 11 | 2.61 | 2.85 | 3.6 | Above average, selective range |
Groups below or around the sample average
| Group | Obs. | Cities | Avg. QP | Med. QP | Avg. ref. | Reading |
|---|---|---|---|---|---|---|
| Selex | 34 | 10 | 2.53 | 2.85 | 4.9 | Good median, penalized average |
| Conad | 48 | 11 | 2.43 | 2.65 | 5.1 | Broad category presence, below-average QP |
| Coop | 37 | 11 | 2.42 | 2.73 | 5.2 | Good coverage, irregular performance |
| Rossetto | 8 | 4 | 2.39 | 2.54 | 6.8 | Broad range, weak QP at group level |
| Unes | 6 | 3 | 2.36 | 2.49 | 5.5 | Below average |
| Sigma | 7 | 3 | 2.31 | 2.34 | 2.4 | Weak |
| Carrefour | 22 | 4 | 2.19 | 2.31 | 6.0 | Broad assortment, critical QP |
| MD | 17 | 9 | 2.12 | 2.09 | 4.2 | Weak |
| Rewe / Penny | 11 | 5 | 1.96 | 2.26 | 2.9 | Weakest among the main groups |
Operational conclusions
Esselunga is the most complete benchmark: high QP, very broad assortment and a solid sample base. It is the banner to take as a reference for advanced management of the berries category.
Aldi is the quality/price leader: very strong, widespread and consistent, but with a more selective range. It is the best model for efficiency.
Lidl confirms a positioning similar to Aldi: high QP and broad territorial presence, but limited assortment.
Pam performs well in the banner-level reading, while Gruppo PAM remains positive but more diluted due to the effect of different formats.
Conad, Coop and Carrefour face a more structural issue: the category is often present, and in some cases also broad, but the average QP remains below the sample average.
In summary, two models win in the berries category. On one side, efficiency and selection, represented by Aldi and Lidl. On the other, depth and quality of management, represented above all by Esselunga. Intermediate banners, instead, need to work on consistency between price, freshness, visual quality and range width.
Read and download the report
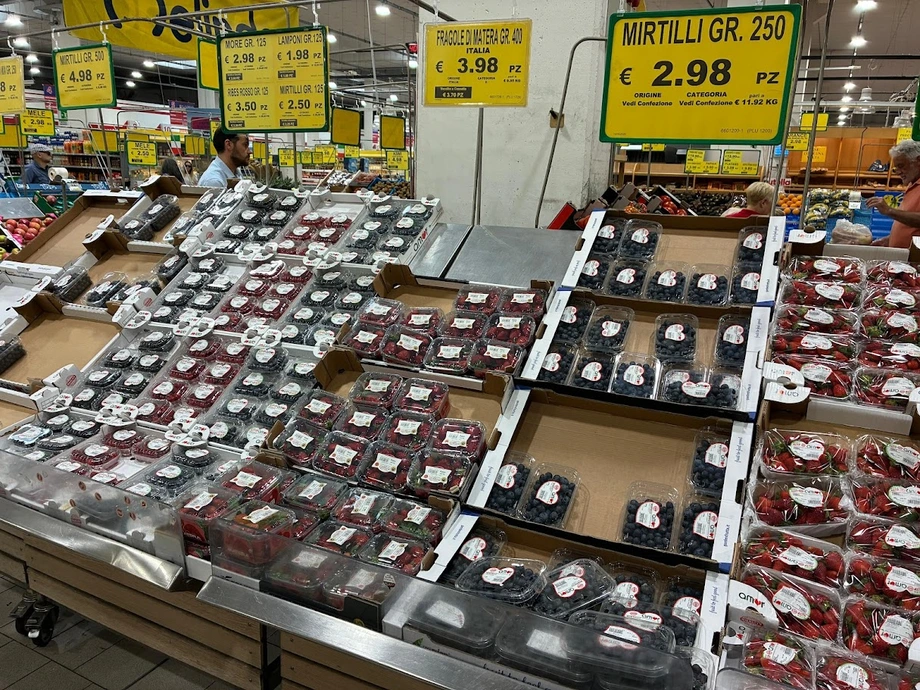
Methodological note
The store quality/price index is calculated as the average of the quality/price indices of all references in the berries category.
A reference is defined as a unique combination of product, weight and segment, for example “Blueberries 125 g standard”.
The quality/price index of each individual reference is calculated by dividing the quality rating by the reference price index.
The quality rating is a subjective assessment carried out by the surveyor; it ranges from a minimum of 0 (presence of spoilage, mold, juice leakage) to a maximum of 3 (healthy and fresh product, substantially free from significant visible defects). The assessment is carried out visually without opening the packs. For each reference and for each brand present on the shelves at the time of the observation, the pack with the best visual quality is assessed.
The reference price index is calculated by dividing the price of the reference in the retail banner under analysis by the average price recorded for the same reference on the same day and in the same city.