


The consumption of blueberries by Italian households is continuing to grow, although in the period July 2021 to June 2022 the growth of blueberries was lower than that of the overall category of berries.
Summary
SPENDING AT +9.7 PERCENT
Spending 91.8 million euros, blueberries is the most important product in the berries category in Italy. In fact, according to Gfk data on Italian household consumption, blueberries accounted for 57 percent of spending in the 12 months between July 2021 and June 2022. During the same period, spending on blueberries increased by 9.7 percent, compared with 14.3 percent overall for the berries category.
BLUEBERRY: CONSUMPTION AND PURCHASING BEHAVIOR OF ITALIAN HOUSEHOLDS (JULY 2021-JUNE 2022)
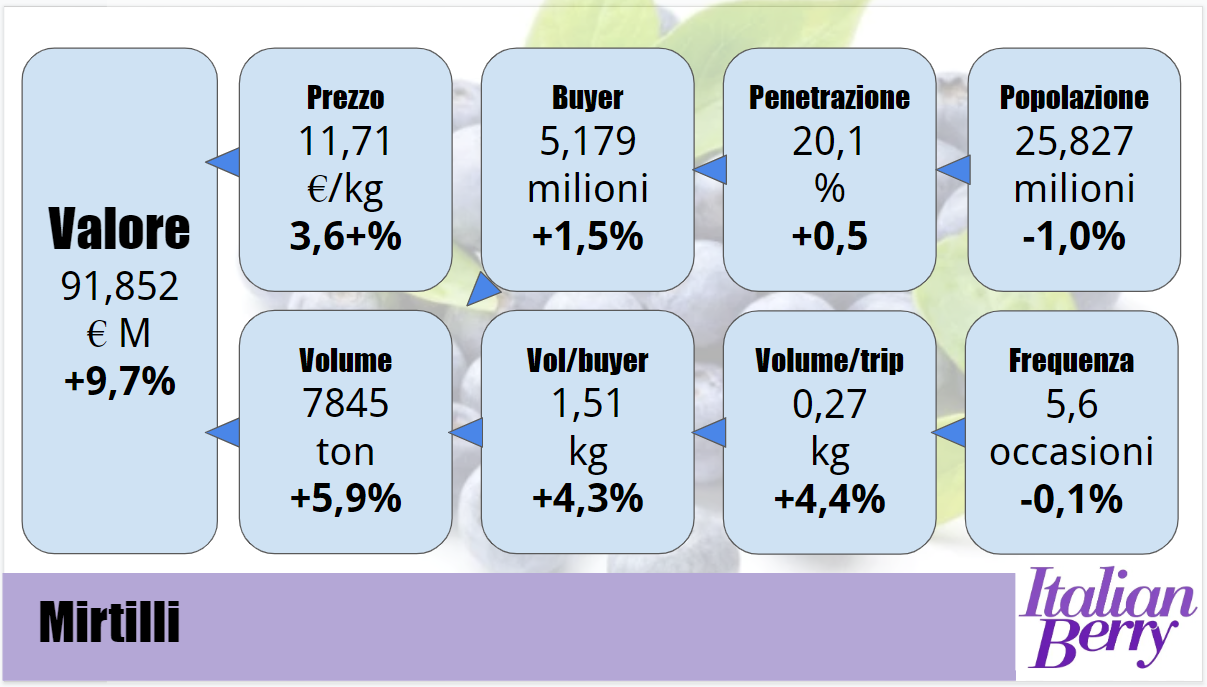
QUANTITY AT 7845 TONS
Volume sales for blueberries amounted to 7845 tons during the same period. In terms of both quantity and value, blueberries achieved lower growth rates than the overall category: in fact, while the category grew by 11.3 percent by volume in the July 2021-June 2022 period, blueberries grew by less than half in percentage terms (+5.9 percent). From a quantity perspective, blueberries account for 62 percent of berries purchases made by Italian households.

STAGNANT PENETRATION
Penetration (the percentage of purchasing households in total Italian households) is 20.1 percent for blueberries. This indicator has realized a basically static trend, with an increase of only 0.5 percentage points in the 12 months prior to 7/31/2022. This means that in percentage terms the pool of purchasing households has not changed significantly.
Moreover, penetration is still particularly low when compared with global champions of blueberries consumption: for example, in the United Kingdom penetration is over 50 percent, so more than one in two British households buys blueberries at least once a year, while in Italy only one in five makes at least one purchase over the course of 12 months.
As a result, a modest 1.5 percent increase in purchasing households was realized, raising them from 5.100M to 5.179M and adding a small group of 79,000 households to the purchasing pool of blueberries.
PURCHASING BEHAVIOR
The Italian buyer of blueberries buys them on average 5.6 times a year and per act of purchase spends an average of Eur 3.16; the average volume purchase is 0.2 kg. While the frequency of purchase is slightly decreasing in the period July 2021 to June 2022 (-0.1%), per act of purchase both average expenditure (+8.1%) and volume purchase (+4.4%) are increasing.
Total purchases per household increased from 1.45 kilograms to 1.51 kilograms over the 12 months under review, while the average expenditure per household increased from €16.42 to €17.74, an increase of 8.0 percent over the period.
EXPENDITURE INDICATORS
Annual expenditure per blueberries was Eur 17.74 in the 12 months under analysis, an increase of 8.0% over the previous 12 months. This represents 61% more than the average expenditure incurred on the purchase of raspberries.
The average price of blueberries was Eur 15.52 (equivalent, for example, to Eur 1.94 for a 125g pack), a slight increase (+3.7%) from the previous period.
MARKET SEGMENTATION
The main features describing the difference in Italian households' consumption are geographical, namely regional areas and urban context.
In fact, in the Northwest, penetration is 70 percent higher than the national average while in South-Sicily it is 61 percent lower than the national average. Urban context is also a determinant of penetration: metropolitan and suburban areas have penetration 37% higher than the average, while in urban areas between 10,000 and 50,000 penetration is 22% lower than the national average.

Other positive peaks in penetration are found in the upper economic classes (+35 percent compared to the national average), 2-member households (+10 percent), and households with purchasing managers aged 55-64 (+11 percent).
In terms of total purchases per purchasing household, the peaks are realized in the Northwest and Central-Sardinia geographic segments and in the middle and upper social classes (all segments with +16% compared to the national average). Even more significant are the differences in the over-65 segments (+21% compared to the average) and residents in metropolitan areas and suburbs (+21%).
All rights reserved - Italian Berry - CC BY License