


Diagnostic tools, nutrient trends and the fine line between measurement and educated guesswork
Jorge Duarte | Hortitool Consulting
Introduction: more data, more confidence… or more illusion?
Berry production has never been as well monitored as it is today. Electrical conductivity (EC) is logged daily. Drainage is measured in millilitres. Leaf analyses arrive with colour-coded sufficiency ranges. Sap analysis promises near real-time feedback. Sensors, dashboards and alerts are now common vocabulary in modern blueberry, raspberry and strawberry farms.
And yet, in technical meetings, a familiar sentence still appears:
“The analysis looks fine, but the plant doesn’t behave as expected.”
This article addresses a simple but uncomfortable question:
Do we really measure enough nutrient trends to advise plants at high performance level, or are we still guessing what the plant needs?
The honest answer lies somewhere in between. We measure a lot. We understand much more than before. But when yields are pushed, margins are tight and quality targets are extreme, nutrition decisions are still partly inferential, not purely diagnostic.
Understanding why is not a weakness. It is the basis of better decision-making.
What “knowing what the plant needs” actually means
When growers say “the plant needs more calcium” or “the plant is short of nitrogen”, they often mean very different things. The root zone may not be supplying enough, the plant may not have accumulated enough, the fruit may not be receiving enough, or growth rate may exceed nutrient flux.
Plants do not need nutrients in absolute terms. They need nutrient flux that matches growth rate, crop load, environmental demand and developmental stage.
Most diagnostic tools measure concentration, not flux. This distinction explains much of the confusion surrounding plant nutrition diagnostics.
The diagnostic families in berry nutrition
Berry nutrition relies on three diagnostic families: root-zone diagnostics, plant accumulation diagnostics and plant flow diagnostics. Each answers a different question, and problems arise when one tool is expected to answer all of them.
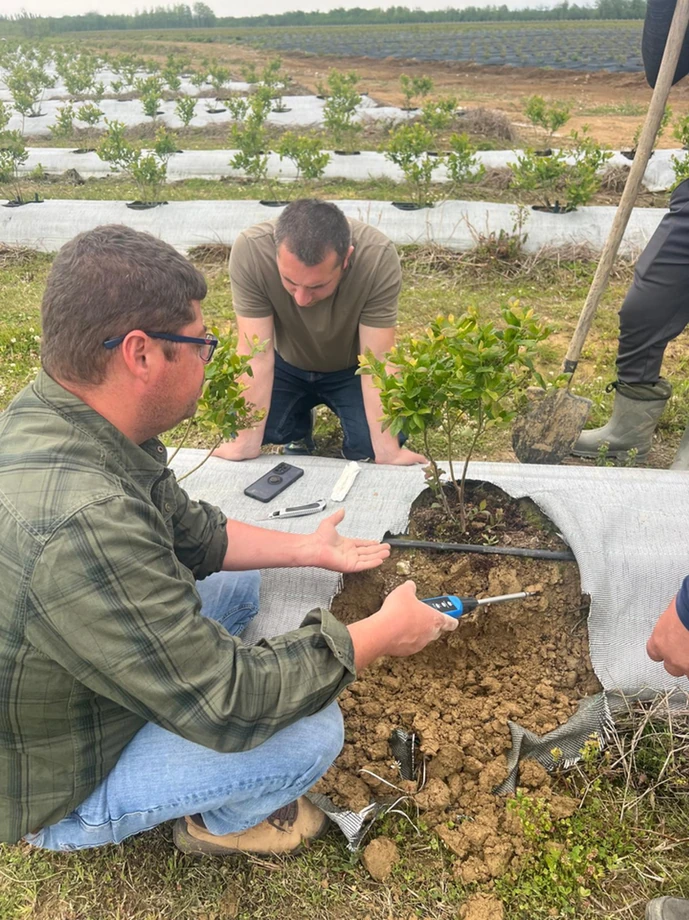
Root-zone diagnostics: what the plant is exposed to
Root-zone diagnostics describe the chemical environment around the roots. In substrate blueberry and raspberry systems, they are the most actionable tools.
They allow growers to adjust EC and pH, manage nitrogen form, control sodium and chloride, define leaching fractions and detect fertiliser build-up early.
Despite their power, results vary depending on extraction method, sampling timing, spatial variability and drainage uniformity. These tools are lenses, not mirrors, and must be interpreted through trends rather than single values.
Leaf tissue analysis: what the plant has accumulated
Leaf tissue analysis remains the most standardised diagnostic method in horticulture. It confirms what the plant has absorbed and retained and whether long-term nutrition is balanced.
At high performance levels it may feel slow, but it works exactly as designed. It is a flight recorder, not a steering wheel.
Sap analysis: measuring flow, chasing signal
Sap analysis offers fast feedback and insight into nutrient movement. In expert hands it can support fine tuning, but variability and lack of standardised interpretation often generate controversy.
It measures movement, not destination, and without protocol discipline can easily be misread.
The uncomfortable truth: we measure supply better than demand
We measure nutrient supply very well, nutrient accumulation reasonably well, but still estimate nutrient demand.
Demand depends on climate, crop load, root health and stress history. No routine diagnostic tool measures demand directly.
High performers don’t eliminate guessing — they manage it
High-performing berry systems do not rely on a single diagnostic tool. They combine root-zone measurements, plant accumulation data and plant performance indicators over time.
Elite berry growers reduce the cost of being wrong by monitoring trends, making small reversible changes and reading plant behavior alongside data.
The practical application of this hierarchy depends on understanding what each diagnostic tool can realistically support. A summary of the main diagnostic layers, measurement methods and associated equipment is presented in Table 1.
Table 1. Diagnostic toolbox for berry nutrition
| Diagnostic layer | What is measured | Typical equipment | Best use | Main limitation |
|---|---|---|---|---|
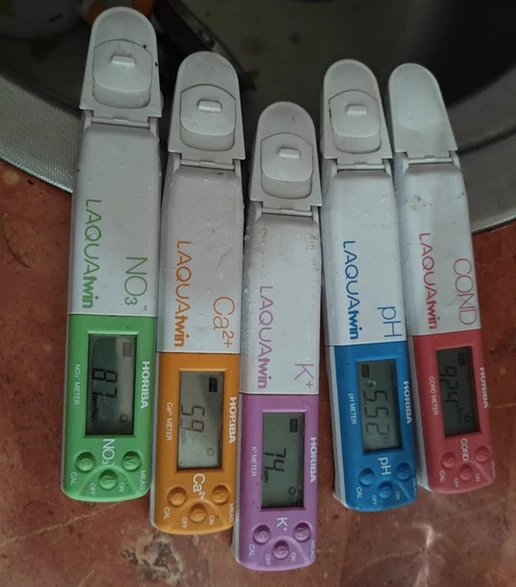
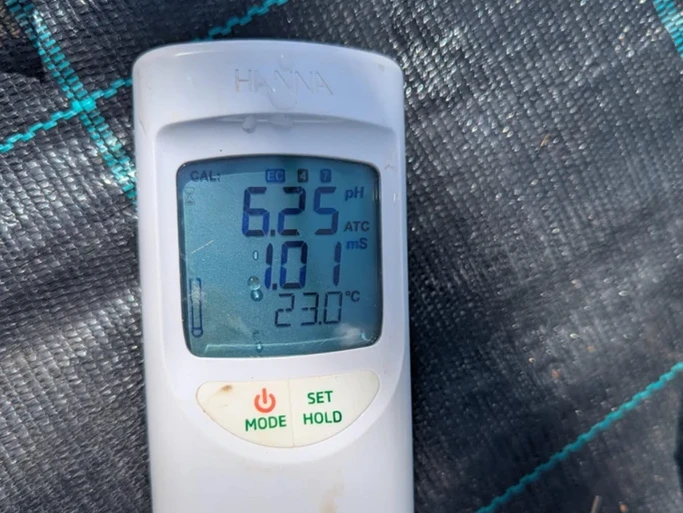
| Irrigation water | EC, pH, alkalinity, Na⁺, Cl⁻ | Portable EC/pH meter, lab | pH and salinity control | Does not reflect uptake |
| Inflow fertigation | EC, pH, nutrients | Inline sensors, portable meters | Verify fertigation recipe | No info on accumulation |
| Drain / leachate | EC, pH, ions | Drain trays, portable meters | Salt build-up detection | High variability |
| Leaf tissue | Accumulated nutrients | Sampling tools, lab | Validate strategy | Not real-time |
| Sap analysis | Mobile nutrient flow | Sap press, handheld meters | Rapid changes | High variability |
A practical diagnostic hierarchy for berries
Control the root-zone environment first, validate accumulation with tissue analysis, interpret plant response, and use sap analysis only when protocol discipline exists.
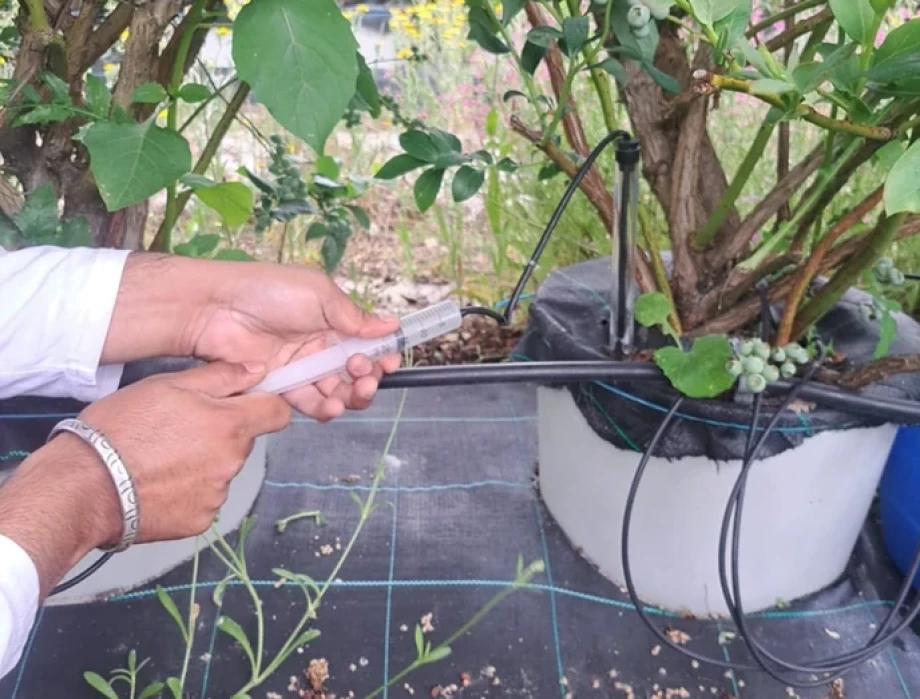
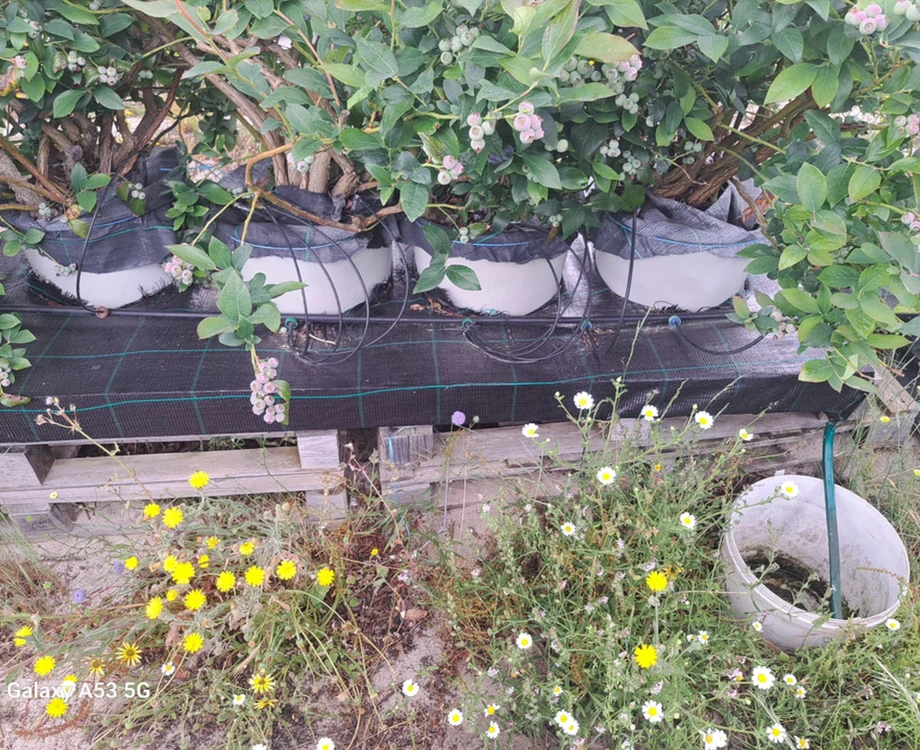
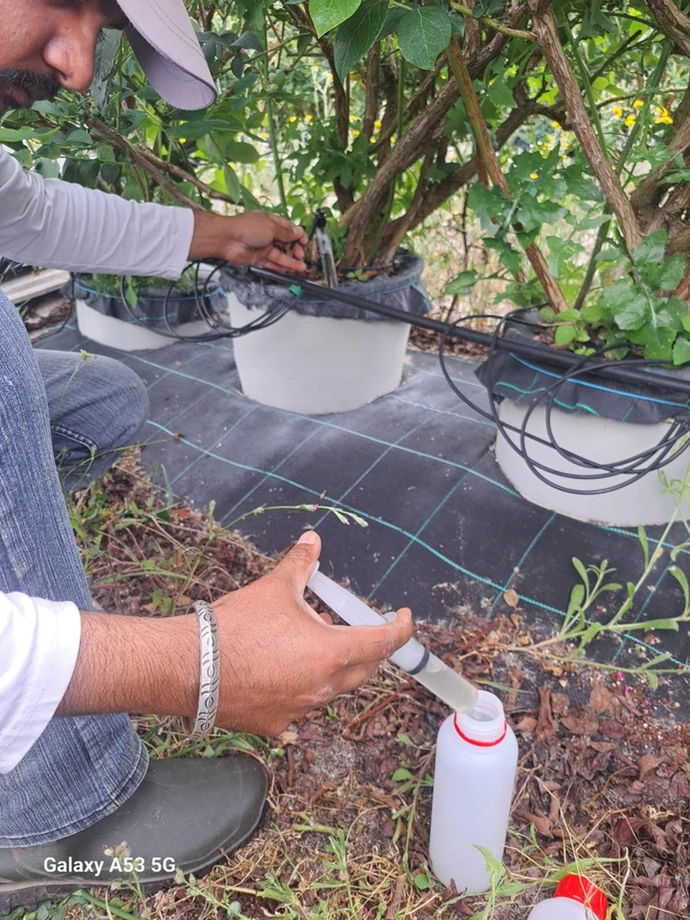
Example of irrigation and drainage collection used to monitor volume, pH and EC.
Are we measuring enough?
Yes, for most operational decisions. No, if we expect certainty rather than probability. Nutrition is process control under biological variability.
The future: less guessing, not zero guessing
Progress will come from better integration of climate and nutrition data, flux-based models, in-line sensors and AI-assisted interpretation.
Final thought
Berry nutrition sits between analytics and intuition. We do not guess blindly, but we interpret every day. That is professional agronomy.
References
Altland, J. (2021). The pour-through procedure for monitoring container substrate chemical properties. Horticulturae, 7(12), 536.
Bryla, D. R., Strik, B. C., & Yang, W. Q. (2022). Leaf tissue macronutrient standards for blueberry. Plants, 11(23), 3376.
Davies, J. N. (1990). Petiole sap analysis in crop nutrition management. Plant and Soil, 123, 247–254.
Strik, B., & Davis, A. (2021). Leaf tissue standards for blueberries. Oregon State University Extension.
USDA-ARS. (1954). Diagnosis and improvement of saline and alkali soils. Handbook 60.
Italian Berry - All rights reserved