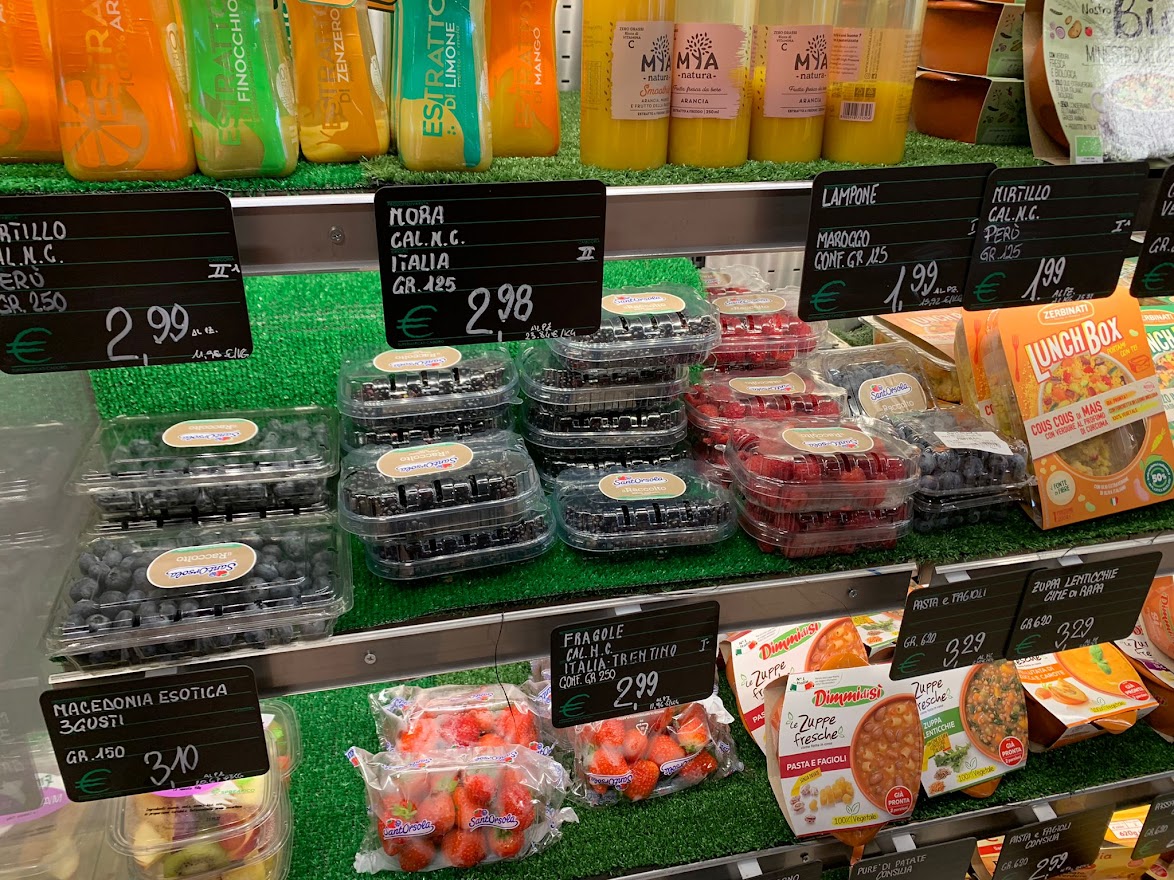
The Packer's Fresh Trends 2024 data shows 54% of surveyed consumers reported purchasing blueberries in the past 12 months, up from 37% in 2023 and 41% in 2022.
Per Capita Availability
Retail per capita availability of blueberries increased from 0.2 pounds (0.09 kg) in 2000 to 2.3 pounds (1.04 kg) in 2021.
Variety of Fresh Produce
Almost 68% of consumers surveyed said they are buying a larger variety of fresh produce today than 20 years ago. 20.5% included blueberries in their response.
Purchases by Income
68.4% of households making more than $100,000 (€92,500) annually reported blueberry purchases, compared to 32% of households making less than $25,000 (€23,125).
Purchases by Age
54.7% of those aged 60 and older, and 58.3% of those aged 50-59 reported blueberry purchases, compared to 46.1% of those aged 18-29.
Purchases by Region
62.1% of shoppers in the Northeast reported purchasing blueberries, while 50.5% of consumers in the South reported purchases.
Price Data
Average shipping-point prices for blueberries in 2023 were $24.79 (€22.96) per carton, up from $19.85 (€18.40) per carton in 2022.
Fresh Trends 2024 Data for Blueberries
Purchases Based on Household Income*
- Less than $25K (€23,125) — 32%
- $25K<$50K (€23,125<€46,250) — 46%
- $50K<$100K (€46,250<€92,500) — 57%
- $100K+ (€92,500+) — 68%
*Annual household income
Purchases Based on Dependent Children
- Have kids — 54%
- 1 kid — 53%
- 2 kids — 56%
- 3 or more kids — 55%
- No kids — 54%
Purchases Based on Region
- Midwest — 51%
- Northeast — 62%
- South — 51%
- West — 54%
Purchases Based on Age*
- 18-29 — 46%
- 30-39 — 56%
- 40-49 — 57%
- 50-59 — 58%
- 60+ — 55%
*Considering primary household buyers
Purchases Based on Ethnicity
- Asian — 53%
- Black/African American — 42%
- Hispanic — 50%
- Other — 56%
- White/Caucasian — 57%


