







What happens to the profitability of a produce department when the retail price increases? And what happens when waste rises, turnover changes or more space is allocated to a product? The answer rarely depends on a single variable, because the result stems from the interaction between closely connected economic and operational factors.
To make these mechanisms easier to understand, Italian Berry has developed an exclusive interactive calculator dedicated to blueberries, raspberries, blackberries and strawberries. The tool is not intended to show how a department should be managed, but to offer all supply chain stakeholders a sandbox model in which they can modify assumptions, observe how the results change and explore the mechanisms that govern category profitability.
A sandbox for understanding the produce department
A produce department is a complex system. Prices, costs, volumes, display space, perishability and labour do not operate independently: every change can produce direct and indirect effects on the other components.
A higher price can increase the unit margin, but it can also reduce demand. A promotion can compress the margin per kilogram while accelerating turnover and limiting waste. A larger display can support sales, but it also entails a higher space cost and the risk of keeping more product on display.
The calculator makes it possible to experiment with these relationships without claiming to replicate a specific store exactly. Its purpose is to help growers, marketing organisations, distributors, retailers, technicians and market observers recognise the variables involved and the correlations between them.
Which variables can be changed
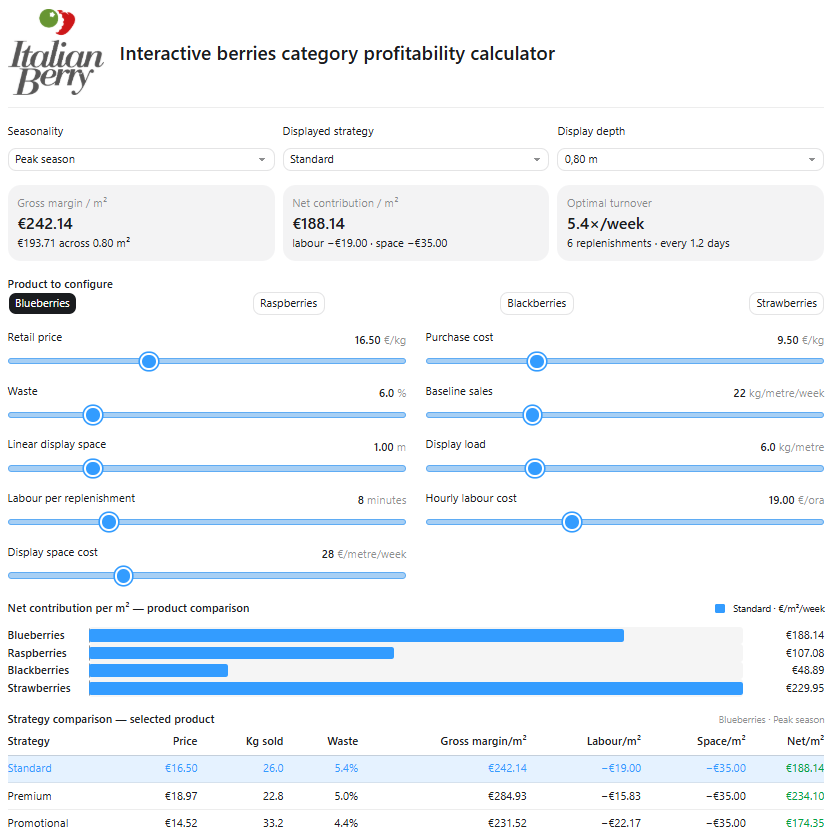
The simulation includes four products — blueberries, raspberries, blackberries and strawberries — which can be configured separately through a set of parameters:
- retail price per kilogram;
- purchase cost per kilogram;
- waste percentage;
- weekly sales per linear metre;
- allocated linear space;
- display load capacity;
- time required for each replenishment;
- hourly labour cost;
- cost attributed to display space.
Display depth also makes it possible to convert linear metres into surface area. Results can therefore be expressed in euros per square metre and compared on a common basis.
The initial values should not be interpreted as market averages or benchmarks. They are simply a starting point for the simulation and can be modified to see how the system responds to different assumptions.

From price to net contribution
The model shows how the retail price translates into gross margin. The calculation takes into account the kilograms sold, the revenue generated and the cost of the quantity purchased, including the product that is subsequently discarded as waste.
The labour cost required for replenishment and the cost attributed to linear space are then deducted from the gross margin. The result is defined as net contribution per square metre.
This indicator does not correspond to the actual profit of the department or store. It does not include overheads, energy, logistics, depreciation and other business costs. Its main purpose is to illustrate the transition between different economic measures and to show the potential impact of variables that often remain in the background.
The role of waste
Waste is not merely a physical loss of product. With sales remaining equal, a higher waste rate requires a larger quantity to be purchased and therefore increases the effective cost of goods sold.
The simulation shows how the margin changes when this percentage varies and how the effect can be amplified for products with a high purchase cost. It also highlights the relationship between waste, sales velocity, seasonality and pricing strategy.
How turnover is represented
The calculator also estimates the number of weekly display loads required to support the assumed sales. The quantity purchased, including waste, is compared with the capacity of the display.
The model assumes that each load uses 85% of the available capacity. This leaves some free capacity to prevent overloading and excessively dense displays. The operational number of replenishments is then rounded up to the next whole number.
The 85% figure is also a simulation assumption, not an industry standard. The capacity that can actually be used depends on the product, packaging, display structure and procedures adopted by the store.

Simulating seasonality
Availability, cost, demand and perishability can change throughout the year. To explore these dynamics, the model offers three seasonal scenarios: peak season, shoulder season and off-season.
The shoulder season is the reference scenario. During peak season, the simulation assumes 18% higher sales, 10% lower purchase costs and a 10% reduction in waste. Off-season, it assumes 28% lower sales, 18% higher costs and a 25% increase in the waste rate.
These coefficients do not necessarily describe the actual performance of a market. They are designed to show how the result changes when several elements move simultaneously and how difficult it can be to attribute a change to a single cause.
Premium and promotional: two scenarios to explore
The calculator also compares three pricing strategies: standard, premium and promotional. The purpose is not to determine which one is best, but to observe the trade-offs between price and volume.
In the premium scenario, the model increases the price by 15%, while reducing demand by 12% and waste by 8%. In the promotional scenario, it reduces the price by 12%, increases demand by 28% and decreases waste by 18%, assuming faster sales.
The table makes it possible to follow the combined effect on price, kilograms sold, waste, gross margin, labour, space and net contribution. The coefficients are simplified assumptions: they are intended to highlight relationships and do not represent guaranteed results or rules that apply to every situation.
Understanding correlations across the supply chain
The sandbox supports a range of perspectives. A grower can observe how the cost of the raw material fits into the department’s economic system. A marketing operator can assess the relationship between price, turnover and waste. Packaging professionals can examine the potential impact of changes in shelf life or display capacity.
Similarly, breeders, technicians and service providers can gain a better understanding of why characteristics such as shelf life, uniformity, resistance to handling and ease of replenishment have consequences that extend beyond product quality alone.
The value of the calculator therefore lies not in the accuracy of any single result, but in the ability to change one variable and observe how that change propagates through the model. It is a tool for asking questions, comparing assumptions and developing a deeper understanding of the category.
Also available on mobile devices
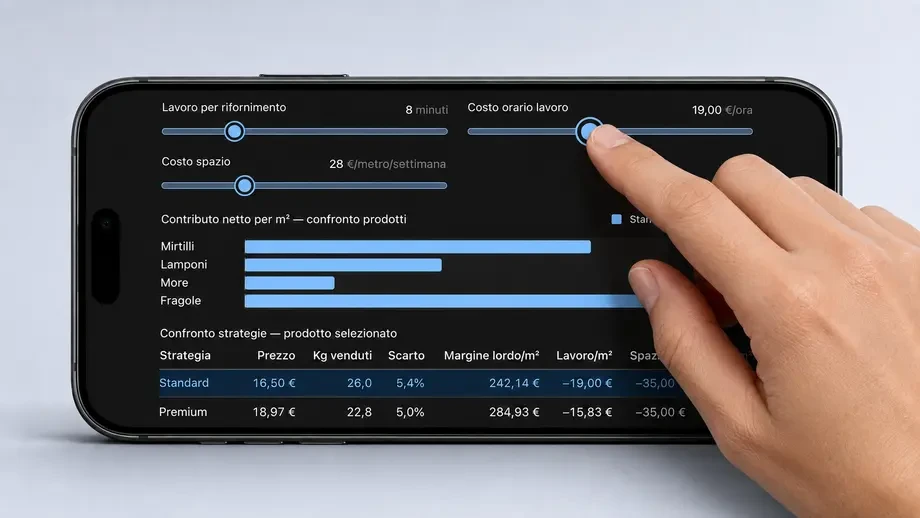
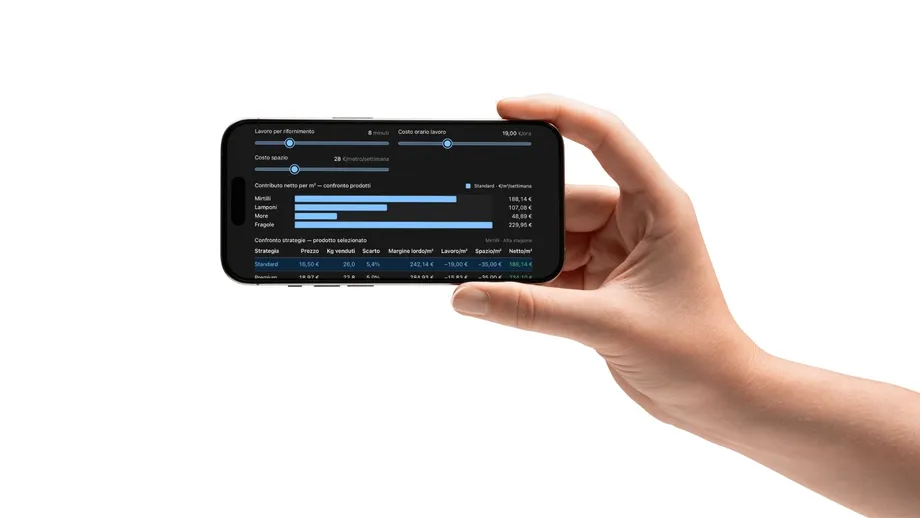
The calculator can also be used on a smartphone: for the best view of the interface and results, users are advised to rotate the screen to landscape orientation.
Thomas Drahorad, Editor of Italian Berry
Italian Berry - All rights reserved