






Cort Brazelton's presentation at the IBO Blueberry World Forum, held in Madrid on October 7, 2026, outlined the new structure of the global blueberry industry, revealing a shift in the balance of the sector even compared with just a few years ago.
Macroeconomic Transformation and Industry Growth Drivers
Over the past two decades, the global blueberry industry has undergone profound industrial restructuring, evolving from a specialized niche agricultural sector into a strategic pillar of high-value international fresh produce trade.
Understanding the structural determinants and development drivers of this market is now essential for supply chain operators and financial decision-makers: blueberry industry dynamics anticipate developments in modern retail, setting the pace on critical issues such as year-round supply continuity, quality-based demand segmentation, and global logistics optimization.
Analysis of Acreage Growth and the Operational Shift
Over the past nine years, global planted acreage has more than doubled. Alongside this substantial expansion, the percentage of hectares not yet in commercial production has declined slightly relative to figures recorded in previous years.
This phenomenon does not signal a halt in development, but rather the emergence of an operational "structural brake": industry expansion is increasingly encountering physical and financial constraints linked to the availability of essential resources.
A second element of this transformation concerns the global shift in the product's end use:
- From the historical balance to fresh market dominance: Twenty years ago, the market was characterized by a broadly even 50/50 split between fresh and processed channels. Historically established as a processing-oriented business, the industry has undergone a radical reversal: today, the fresh segment is the single true driving force behind the entire value chain.
This operational realignment is also clearly reflected in the geographical distribution of global consumption and production:
- Global geographical rebalancing (2020 vs. 2025): A comparison of production and consumption shares in 2020 with estimates for 2025 reveals a gradual and crucial rebalancing between the Americas, EMEA (Europe, the Middle East and Africa), and Asia. This development reflects the achievement of a balance in global consumption, consolidating the blueberry as a truly worldwide crop, produced and consumed evenly across all major world regions.
However, this substantial increase in planted acreage and the central role of the fresh market are shifting the focus of business competition from simple acreage expansion to yield per unit of area.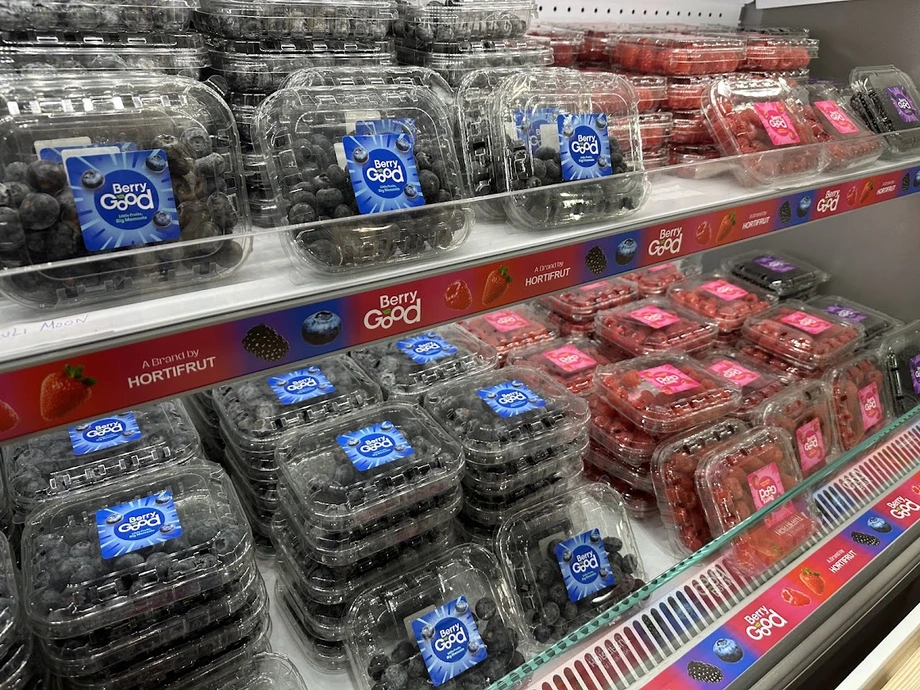
The Crisis in Global Average Yields and Economic Sustainability
In today's competitive environment, production efficiency expressed in terms of yield per hectare is more than an agronomic indicator: it is the primary dividing line between the economic sustainability of a farming business and a slide into financial distress.
In an environment of rising operating costs per unit, average yield is the fundamental variable governing the absorption of fixed costs and the generation of net operating margins.
Breaking Down Yield Data and the Break-Even Threshold
Industry data indicate a global average yield of 9 tonnes per hectare. From a methodological standpoint, it is crucial to emphasize that this calculation excludes young plantings and those not yet in commercial production, focusing exclusively on mature plantings, defined according to strict age criteria linked to chill requirements:
- High Chill: plantings aged 4 years or older;
- Mid Chill: plantings aged 3 years or older;
- Low Chill and Zero Chill: plantings aged 2 years or older.
Given this rigorous selection of data, an average production level of 9 t/ha from mature plantings represents what Cort Brazelton bluntly describes as "economic death". 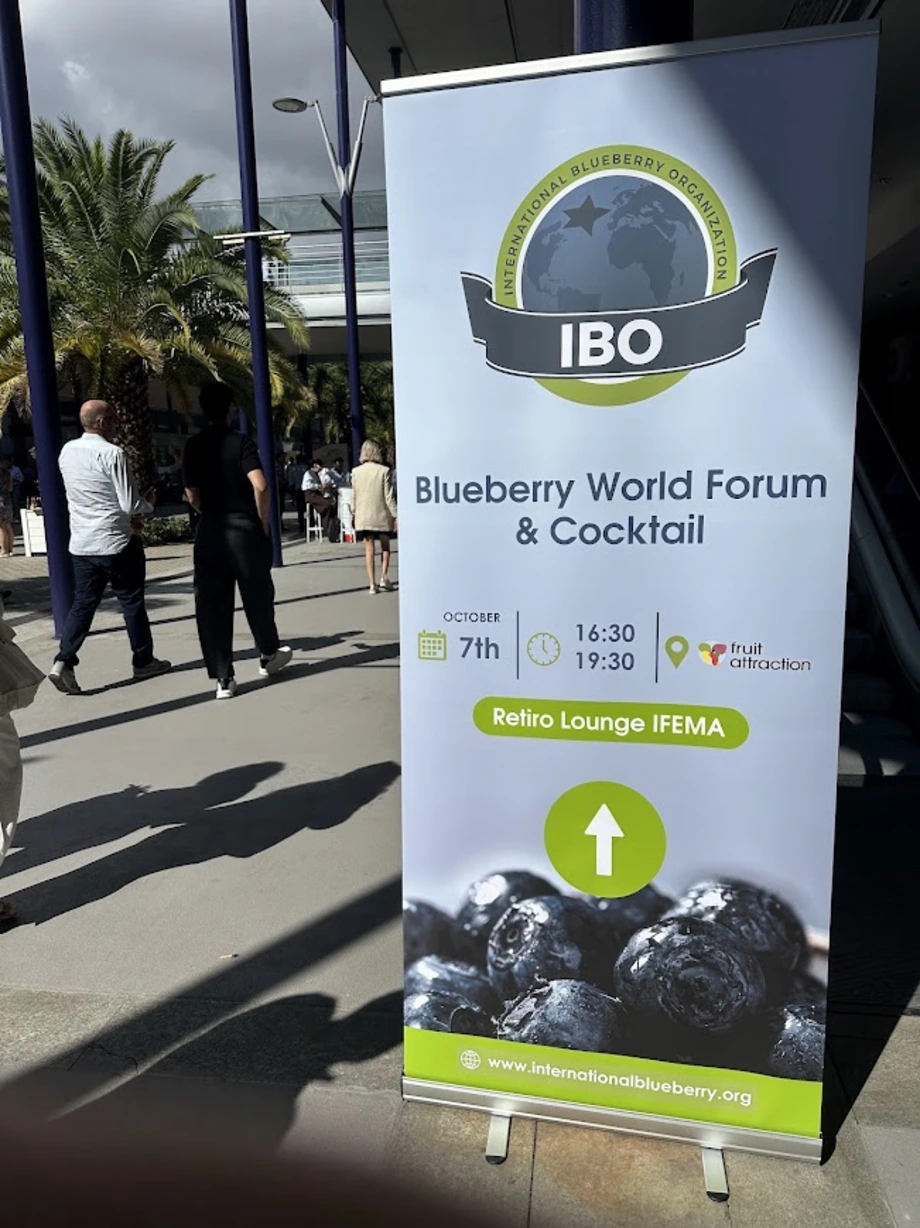
This figure lies well below the break-even point: operating at these levels eliminates net profitability and makes the business financially unsustainable over the medium term.
The strategic and economic gap between businesses capable of exceeding baseline performance and those stuck at the global average is summarized in the following comparative table:
| High-Yield Businesses ("Winners") | Businesses at the Global Average of 9 t/ha ("Losers") |
|---|---|
Yield and Operational Performance: Achieve yields significantly above 9 t/ha; comfortably exceed the break-even point by spreading fixed costs over greater volumes and absorbing increases in operating expenditure (Opex). | Yield and Operational Performance: Remain at the average of 9 t/ha from fully mature plantings (High, Mid, Low and Zero Chill); consistently produce below the economic break-even threshold. |
5-Year Outlook: Strong financial sustainability; capacity to reinvest in genetic innovation, automation, and planting renewal. | 5-Year Outlook: Destined to exit the market or cease operations within 5 years because they cannot cover operating and capital costs. |
The economic evidence showing the unsustainability of insufficient yields highlights that the projected expansion in global volumes by 2030 cannot rely on simply replicating current farming models, but will have to contend with specific physical and financial constraints.
Production Projections to 2030 and Structural Constraints Across the Industry
Estimates of global supply trends point to a continued growth trajectory in volumes.
However, analysts and business decision-makers must interpret and assess quantitative metrics in light of the limiting production factors affecting the agri-food supply chain.
Assessing Volume Estimates and Operational Bottlenecks
Quantitative simulation models indicate an increase in global supply of more than 1 million tonnes (+1.03 million tonnes) by 2030 compared with baseline volumes in 2025, bringing total production to 3.36 million tonnes.
This expansion appears highly plausible over the short to medium term, as it is supported primarily by plantings already established or currently being completed.
From a methodological perspective, projections based on historical regression analyses have inherent limitations and have required operational adjustments to account for the impact of extreme climate events, such as El Niño, which severely affected plantation productivity in Peru and other key regions.
Over the long term, the global production growth curve is expected to flatten. This slowdown will not be caused by declining demand — which remains strong and receptive — but by the combined pressure of 5 structural constraints across the industry:
- Land Availability (Land): Increasing saturation of suitable land and sharply rising land costs in prime growing areas.
- Water Resources (Water): Growing scarcity and rising costs of securing irrigation water.
- Labor Shortages and Rising Costs (Labor): Declining availability of agricultural workers, rising wages, and adverse demographic trends.
- Capital Availability (Capital): High initial investment requirements (Capex), coupled with rising borrowing costs and tighter lending criteria.
- Management Skills and Talent (Talent): A shortage of specialized professionals capable of managing plantings with high levels of technological and agronomic complexity.
This inevitable slowdown in physical volume growth shifts the focus from total quantities to selling price structures and the dynamics of capturing product value.
Price Dynamics, Polarization, and the Rise of the 'Next-Level Quality' Category
Analysis of the estimated global average price at the border risks producing misleading interpretations unless complemented by a rigorous breakdown of product quality.
The global blueberry market is undergoing profound polarization, in which the arithmetic average of prices no longer reflects actual profitability dynamics.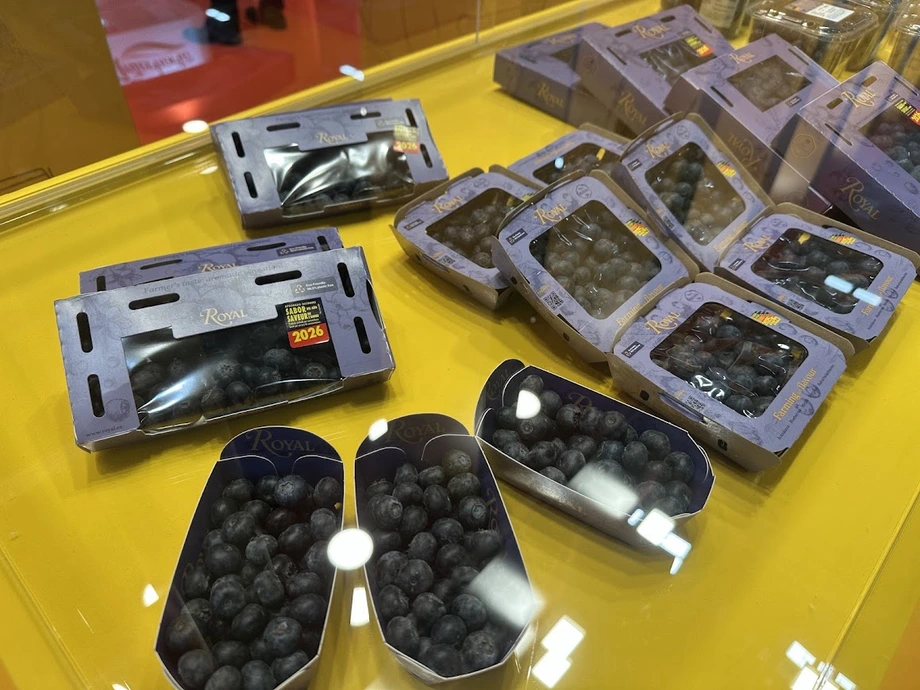
The Anatomy of Market Polarization and Premium Pricing
When assessing the real average import price, adjusted for inflation, figures for 2024/2025 (approximately $6.64/kg) show a value broadly equivalent to that recorded in 2016.
However, this apparent stability conceals a highly bimodal market. The resilience of the average price is not attributable to a general increase in the value of standard fruit, but to the strong contribution of the product category defined as "Next-Level Quality" or Premium:
- Attributes of the Next-Level Quality Segment: This category is defined by precise sensory and physical requirements, such as large size, high crispness (firmness), optimal texture, and distinctive flavor profiles, supported by the latest generation of patented varieties.
- Share of Volumes and Seasonality: During peak supply periods in the Southern Hemisphere (between late October and early November), Next-Level Quality fruit accounts for between 30% and 40% of total volumes traded globally. By contrast, during the Northern Hemisphere summer window (particularly in July and August), the presence of this segment falls below 1%, revealing a structural shortfall and an untapped market opportunity.
- Price Differential (Premium Pricing): Superior quality commands a consistent value differential, securing a price premium of between $1.50 and $3.00 per pack/sales unit over commodity fruit.
“Premium fruit has a [price] floor. Commoditized fruit has a cliff.”
The unavoidable demand for higher quality standards is reshaping production geographies and international trade routes.
Production Geography and New Consumption Maps
International trade flows are reorganizing around new production hubs and major importing regions, changing the historical balance between exporting countries and destination markets.
Analysis of Leading Global Players and Trade Routes
Global supply is highly concentrated: the Top 10 producing countries (including China, Peru, the USA, Chile, and Morocco) account for 85% of planted acreage and generate approximately 90% of total volumes (representing almost 90% of the fresh market).
Among the most significant developments are the rise of Morocco (which has overtaken Spain and Ukraine) and Peru's historic overtaking of the United States in volumes of fresh fruit destined for export.
Within this scenario, China's market has a highly differentiated three-tier structure:
- Domestic Industrial Absorption: China's vast agricultural production is largely destined for the local processing industry to produce juices and derived products, notably including the distillation of Moutai blueberry liquor.
- Imports of Premium IQF Fruit: Demand for high-quality individually quick-frozen (IQF) blueberries in bags for the retail channel is met almost exclusively by supplies from the United States, Chile, and Canada.
- Limited Fresh Imports: Fresh import volumes into China remain limited; Chinese consumers have extremely specific and high domestic quality standards ("their standard of what is good"), which large international flows of generic fruit struggle to meet.
Across the major importing blocs, the data reveal a fundamental reshaping of the consumption hierarchy:
| Trading Bloc / Market | Import Volume Dynamics and Characteristics |
|---|---|
EU (The "Big 6") + United Kingdom | The world's largest market by import volume. It has overtaken the combined USA + Canada market, establishing itself as the main destination for global trade flows. |
United States + Canada | The world's second-largest importing bloc; a mature market characterized by lower percentage growth rates than the European region. |
China | Limited fresh imports alongside massive domestic production; a market with highly selective quality requirements. |
The emergence of these new geographical configurations requires a direct comparison between the cost structures of traditional growing regions and those of emerging production areas.
Rebalancing Unit Costs and Climate Volatility: Established Regions vs. New Frontiers
Competition between established production regions and recently developed growing areas is evolving toward a phase of convergence in production costs per unit.
Economic and Structural Comparison and Climate Impact
Established, mature regions (the Pacific Northwest in the USA, Chile, Michigan, and Poland) operate with aging plantings and packing infrastructure.
By contrast, the new production frontiers (Peru, Mexico, Morocco, and southwestern China) have developed modern, capital-intensive growing areas.
A comparative analysis of cost structures reveals significant differences:
- Capital Expenditure (Capex): Established regions benefit from infrastructure investments that have already been depreciated, with Capex for establishing new blueberry plantings at approximately 1/2 the cost required to develop new acreage in Peru, Mexico, or Morocco.
- Operating Costs for Chemical Inputs (Opex): Fertilizer and crop protection costs in established regions amount to approximately 1/3 of those incurred in emerging countries.
- Labor, Mechanization, and Demographics: Although hourly labor costs have historically been higher in developed countries, flat terrain and the expansion of mechanical harvesting provide substantial scope for efficiency gains. By contrast, emerging regions face rising operating costs and an unexpected demographic squeeze: the total fertility rate (TFR) is falling sharply in South America (in Medellín, Colombia, the TFR is now lower than in Tokyo), reducing the future availability of agricultural labor.
 Based on these dynamics, analysts forecast parity in production costs per unit within the next 10 years between established and emerging regions.
In this context, South Africa benefits from a temporary economic adjustment margin (cushion): its labor dynamics and ongoing structural reforms allow it to remain temporarily further behind South America on the unit-cost pressure curve, giving it a longer window in which to adapt its operating models.
This picture is compounded by the impact of climate volatility, which over the past 18 months has affected the world's main growing areas across the board, demonstrating that weather risk is an unavoidable systemic variable.
Pressure on margins and environmental challenges are accelerating the entire supply chain's transition toward technological scalability and process innovation.
The Technological Innovation Ecosystem and Guidelines for the Future
The sector's achievement of industrial critical mass has triggered a qualitative leap: the blueberry industry can now attract financial capital and advanced technology players.
A true ecosystem of specialized suppliers has emerged to develop dedicated solutions: companies specializing in precision pollination, harvesting robotics, postharvest optical sorting and quality grading systems, artificial intelligence algorithms for yield forecasting, and drones for aerial monitoring of crop health.
Strategic Synthesis: The 6 Pillars of Industry Governance
Summarizing the analytical findings, Cort Brazelton's report identifies 6 strategic guidelines for the industry's future governance:
- New Demand Must Be Earned: The global market no longer absorbs every type of product; consumption growth depends on the ability to deliver the quality required.
- Rising Consumer Expectations: Downward pressure on average consumer prices goes hand in hand with increasingly stringent quality requirements and declining tolerance for defects in texture or flavor.
- Achieving Scale for 'Next-Level Quality': Superior quality has evolved from a niche into a mass-market segment representing up to 30%-40% of volumes during peak periods.
- Reversal of Regional Comparative Advantages: The gradual convergence of unit costs between established and emerging regions is redrawing the geographical map of profitability.
- Year-Round Supply Remains Incomplete: A marked shortage of 'Next-Level Quality' fruit persists during the Northern Hemisphere summer months, when premium supply falls below 1%.
- Innovation Accelerated by Scale: The critical mass achieved by the industry enables it to fund and deploy advanced technologies and new genetics to overcome operational bottlenecks.
Final Summary
The global blueberry industry is entering a crucial five-year period of industrial maturation and business selection.
The key to long-term profitability will lie in growers' and investors' ability to manage the transition toward production efficiency, answering the decade's fundamental question: how to grow global demand, economic returns for growers and the consistent quality of fruit offered to the market at the same time.
Italian Berry - All rights reserved